
SAP Analysis vs Tissue Testing: What the Research Actually Shows
An evidence-based comparison of plant sap analysis and conventional leaf tissue testing, drawn from peer-reviewed research and real-world agronomy.
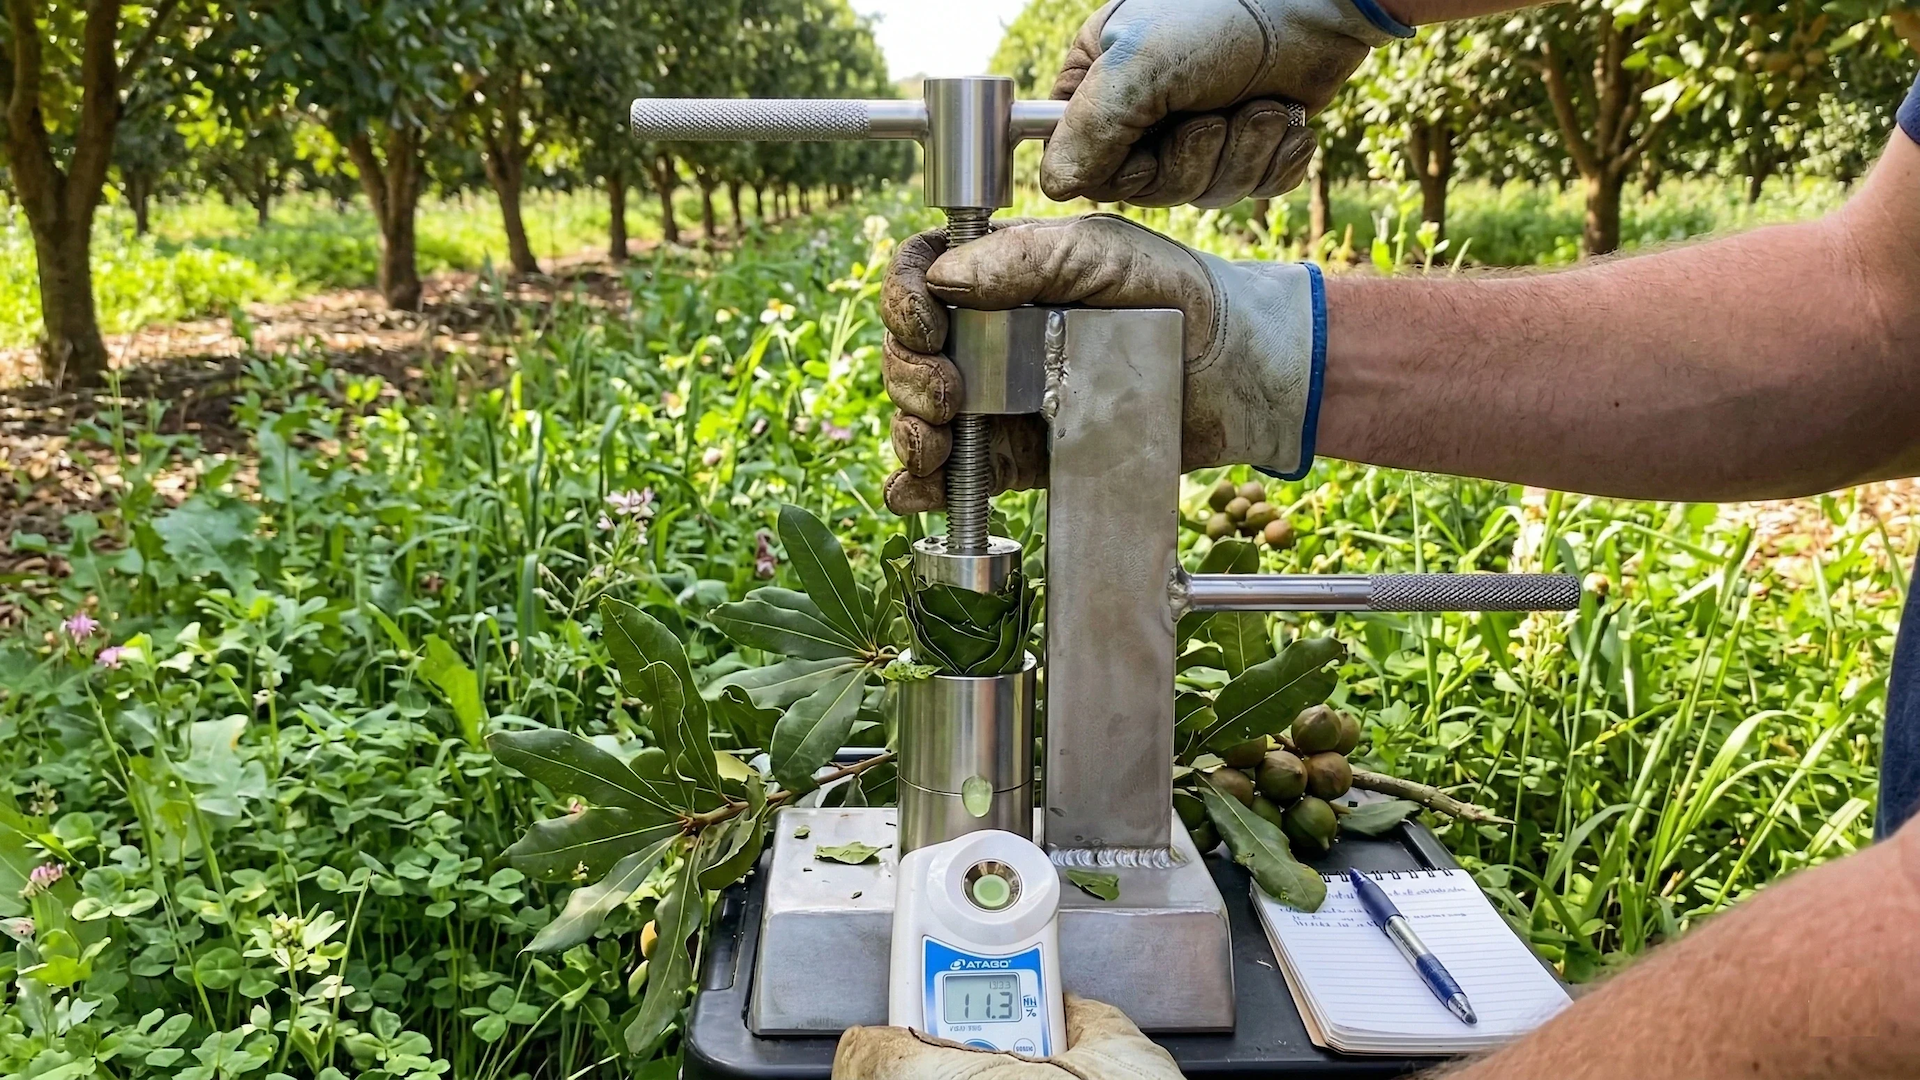
Sap analysis goes by a few names. You will hear it called plant sap analysis, petiole sap testing, or the xylem-phloem test. The method itself is simple: fresh leaves are pressed to extract the sap, and the soluble nutrients in that sap are measured. What matters to you as a grower is what those readings tell you that a conventional tissue test cannot.
The research comparing sap analysis to tissue testing is still maturing, but the picture is clearer than it was a decade ago. The two methods are not interchangeable. They answer different questions, and each has documented strengths and limitations. Choosing between them, or using them together, comes down to what decision you need to make.
What Sap Analysis Actually Measures
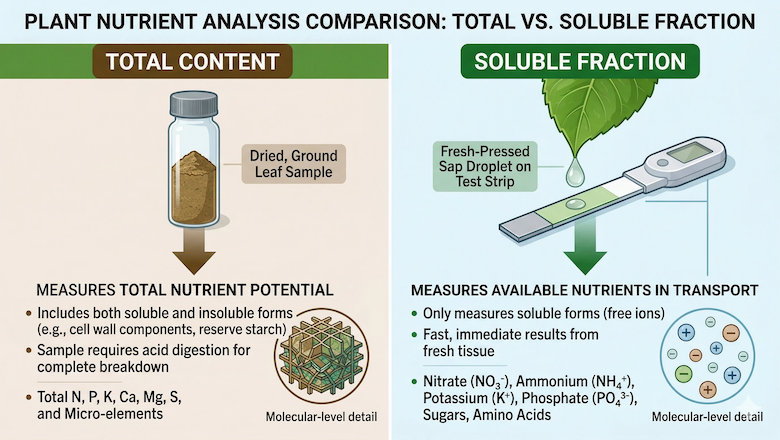
Tissue analysis grinds up a dried leaf and reports total nutrient content, which includes nutrients locked in cell walls, stored in vacuoles, or bound in structural compounds. Sap analysis reports only the soluble fraction moving through the xylem and phloem at the moment of sampling. That difference is the whole story.
Hochmuth (1994), writing in HortTechnology, laid the groundwork by establishing calibrated sap sufficiency ranges for nitrate-nitrogen and potassium in vegetable petiole sap quick tests. His work showed that sap readings could guide in-season nitrogen decisions in ways that dry tissue results could not, because sap responded to recent fertigation within hours while tissue content lagged by days or weeks.
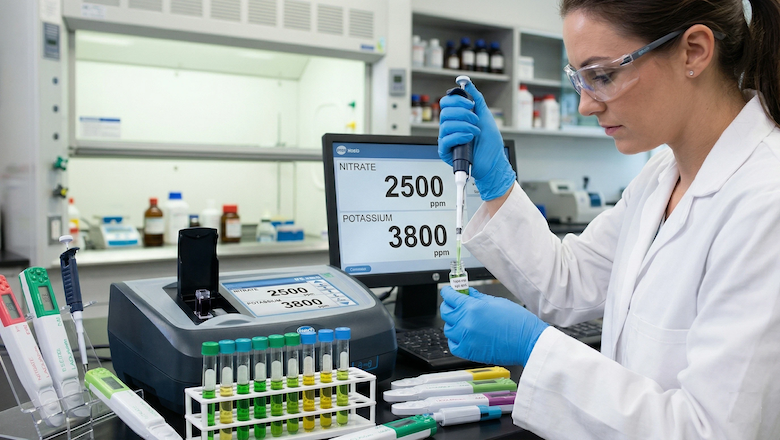
More recent work by Lu et al. (2022), published in Frontiers in Plant Science, evaluated compact ion meters for real-time sap analysis of nitrate, potassium and calcium, and compared those readings to conventional lab tissue methods. They found workable correlations for some ions and some crops, but also flagged interpretation limits. Sap values shift with time of day, leaf position, and recent weather. A single snapshot is not the same as a fertility plan.
Where SAP Analysis Has the Edge
The case for sap analysis rests on three things the research consistently supports.
It responds faster. Because sap measures soluble, mobile nutrients, it reflects recent uptake and recent applications. If you foliar-fed zinc on Monday, a sap test on Thursday will show it. A dry tissue test might not show a clear shift for another two to three weeks. Fox et al. (2025) in HortTechnology compared sap and conventional leaf analysis in tree crops and documented this lag directly.
It exposes antagonisms. Rietra et al. (2017), in a review in Communications in Soil Science and Plant Analysis, catalogued the synergistic and antagonistic interactions that shape fertiliser use efficiency. A high-profile example is the potassium-magnesium relationship. Xie and Cakmak (2021), in The Crop Journal, reviewed the competitive uptake between K and Mg and showed that high K supply can suppress Mg uptake and translocation even when soil Mg is adequate. Xu et al. (2020), in Frontiers in Plant Science, reached similar conclusions. A tissue test may show both nutrients in range. A sap test can reveal a K:Mg ratio that tells you why the plant is still struggling.
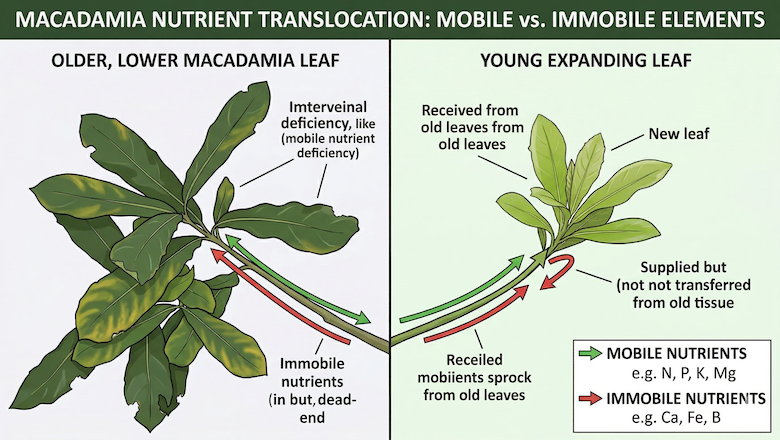
It reads new and old leaves separately. This is where sap analysis earns its reputation for catching hidden hunger. Plants move mobile nutrients such as nitrogen, phosphorus, potassium, magnesium, molybdenum and zinc from old leaves to new growth when supply is tight. Immobile nutrients such as calcium, boron, iron and manganese cannot be relocated. By sampling both age classes, sap analysis shows which way the plant is leaning before symptoms appear on the leaf surface.
- Sap is dynamic, tissue is cumulative. Sap reflects current flux, tissue reflects what has accumulated since leaf formation (Hochmuth, 1994; Lu et al., 2022).
- Mobile vs immobile nutrients behave differently. Mobile nutrients drop in old leaves first, immobile nutrients drop in new leaves first.
- Antagonisms show up in sap ratios. K:Mg, Ca:B and N:K ratios reveal interactions that total content misses (Rietra et al., 2017; Xie and Cakmak, 2021).
- Sampling protocol is not optional. Washing and cutting petioles changes sap readings (Farneselli et al., 2006).
- Sap composition varies day to day. Repeat sampling improves reliability (Santa Cruz et al., 2025).
Where Sap Analysis Has Real Limits
Sap analysis is not a silver bullet, and the peer-reviewed literature is clear about where it wobbles. Santa Cruz et al. (2025), in Agronomy, documented inter-day instability in sap composition that can undermine straightforward interpretation. Two samples taken from the same block on consecutive days can give different nitrate or potassium numbers. That does not mean the plant changed. It means sap is a moving target.
Farneselli et al. (2006), in Communications in Soil Science and Plant Analysis, showed that washing or cutting petioles before pressing reduces nitrate and potassium concentrations in the extracted sap. Handling matters. If your lab does not follow a strict SOP, your results will drift. Thompson et al. (1996) split-sampled petioles for sap and dry tissue and reported that correlations between the two methods are workable for some crops and thin for others.
The honest summary: SAP analysis gives you a sharper view of current plant status, but only if the sampling is clean, the timing is consistent, and the interpretation accounts for known instability.
How the Two Methods Fit Together on the Farm
Once you understand what each method measures, the choice is not really either-or. Tissue testing is still useful for season-end reviews and for comparing blocks or varieties over time, because total content gives you a stable benchmark. Sap analysis is the tool you reach for when you need to make a decision this week, not next month.
If your tissue test shows calcium in the "adequate" range but your new leaves are showing tip burn, a sap test on new growth will often confirm that calcium is not reaching the expanding tissue, which is a transport problem that total-content testing cannot see. If your crop looks healthy but yield is drifting below expectation, paired sap samples from new and old leaves will show which nutrients are being scavenged and give you a specific foliar or fertigation target.
The Bottom Line
Sap analysis is not a replacement for tissue testing, and the research does not claim that it is. What the peer-reviewed work of Hochmuth, Lu, Fox, Rietra, Xie and Cakmak, and others consistently shows is that sap analysis answers a different question, faster, and with more sensitivity to antagonisms and early imbalances. It also carries real sampling and interpretation constraints that Farneselli, Santa Cruz and Thompson have all documented.
For growers choosing between the two, the practical position is this. Run tissue tests for long-range benchmarking and variety comparison. Run SAP tests when you need to know what the plant is doing right now, and when you want to catch hidden hunger before it cuts yield. Neither tool is perfect. Together, they give you a more complete picture than either one alone.
Want to put SAP analysis to work on your farm? Oceanic Organics supports growers across KwaZulu-Natal and Mpumalanga with SAP-led nutrition programmes grounded in peer-reviewed research.